

By Peter Squire
When it comes to real estate and making one of the most important purchases in your lifetime, One of those key pieces of information is determining the value of the home you want to purchase — or sell.
To this end, WinnipegREALTORS® has added a new tool to help its REALTORS® provide more data support and back-up evidence to their comparable market analysis (CMA). It is called the MLS® Home Price Index — or MLS® HPI.
CREA developed the MLS® HPI in partnership with Altus Group in response to other new house price indexes being created in Canada, such as the Teranet National Bank Home Price Index. While other indexes use repeat sales (the home must have sold at least twice) to determine house price inflation on a monthly and yearly basis, CREA’s MLS® HPI departs from that method and includes all MLS® sales.
Using more than a decade of sales history, the developers of this sophisticated methodology are able to determine what they call an HPI “benchmark concordance house” that fits a typical property within each market and market sub-area. The baseline and start year for CREA’s data is 2005 and it tracks monthly price trends and levels beginning in January of each year.
The MLS® HPI was launched in 2012 and has expanded rapidly to include most major metropolitan markets in Canada. The MLS® HPI is available for single family homes (further split into one- and two-storey homes), townhouse/row units, and apartment condo units. These sub-indices are used to calculate a composite or overall MLS® HPI in each housing market being tracked, and is also used to calculate an aggregate MLS® HPI for the collection of metropolitan markets.
HPI is better known for what it is not than what it is. HPI is seen as a far more accurate measurement of calculating house pricing trends than average or median prices. HPI overcomes the wide differences and composition of properties included in average and median pricing by keeping the qualities of a typical property constant over time so its change in value is the result of pure price change, not monthly fluctuations. It is a more stable price indicator than average prices because it tracks changes of “middle-of-the-range” or “typical” homes and excludes the extreme high-end and low-end properties.
HPI is comparable to the well-known Consumer Price Index (CPI) which tracks consumer price inflation or deflation by following a constant basket of goods and services such as food, clothing and transportation. The MLS® HPI measures the rate at which house prices change over time by taking into account a basket of housing features which remain constant over time. It makes the MLS® HPI the best tool for “apples-to-apples” historical price trend comparisons.
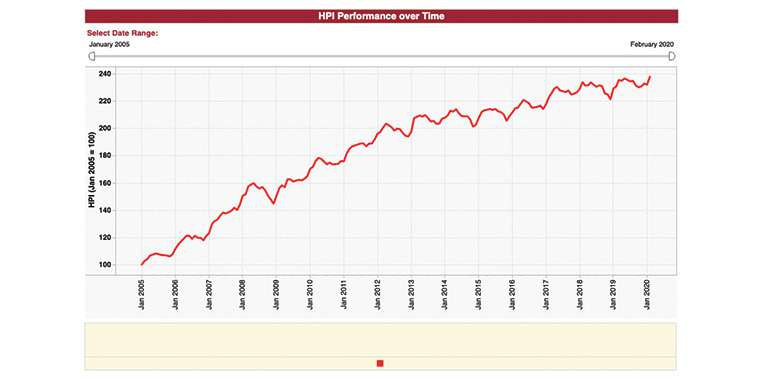
As you can see in the chart above, by tracking a one-storey home in the WinnipegREALTORS® market region, and using 100 as the starting point in 2005, you simply subtract 100 from the total number in February 2020 to determine that this property type has gone up 127 per cent in 15 years. In January 2005 it was priced at $119,300. By February of this year, the price of this one-storey home was $270,700.
The HPI home — or benchmark description — was determined by combing through over 10 years of MLS® sales data. The typical home was built in 1970, has 6 rooms, 3 above-ground bedrooms, 2 full bathrooms, a gross living area above ground of 1,111 sq. ft., a lot size of 5,880 sq. ft., an attached single garage and a finished basement.
If you were only going to look at Winnipeg, the one-storey home benchmark description is slightly different. Here, the typical home has 7 rooms instead of 6, has a smaller lot size of 5,100 sq. ft. and was built in 1962. Its price in January 2005 was $120,000 and in February 2020 was $278,500 — a 132 per cent increase.
Where the MLS® HPI becomes a really valuable supplementary tool to REALTORS® CMA is that Altus Group has developed benchmark home descriptions based on the rich history of sales data in all of the MLS® areas within WinnipegREALTORS® market region. For example, a one-storey home in the Linden Woods/Linden Ridge MLS® area was $241,000 in January 2005 and is now $469,200. The benchmark description of this home is 9 rooms with 4 bedrooms (one finished below ground) and 3 full bathrooms, 1,672 sq. ft. of gross living area above ground, a lot size of 6,490 sq ft, two-car garage, a finished basement and one fireplace.
It is important to note that benchmark descriptions for the four main property categories will vary based on the most common characteristics observed in all of the MLS® areas being tracked. Some MLS® areas will not include a property category if there is not enough sales history. For example, the MLS® HPI does not include townhouses in the MLS® areas of St. Boniface and Norwood .
“HPI puts powerful trends and statistical data to use for REALTORS® so they can provide clients with the best and purest way of determining price trends in the local market,” said Catherine Schellenberg, president of WinnipegREALTORS®.
She added, “Winnipeg is now on the national map when it comes to CREA’s MLS® HPI monthly market reporting and was cited in CREA’s February market release as being on a slow upward trend since the beginning of 2019”.
Your REALTOR® has never been more prepared to help you navigate your way toward the successful purchase of your lifetime home.
Peter Squire is WinnipegREALTORS® Vice-President, External Relations & Market Intelligence.