

by Peter Squire
It often appears that when national stories are written about the state of Canada’s housing market, it is generally treated as one ubiquitous entity that disregards the details affecting what is actually happening across the country.
Some of the most misleading headlines in recent times arose out of the CMHC Housing Market Assessment (HMA) quarterly reports. CMHC has grabbed headlines for the past two years by repeatedly stating, as it did again in the most recent Third Quarter 2018 release, that “Canada continues to indicate a high degree of overall vulnerability for the housing market at the national level for the eighth straight quarter.”
If you dig further into their national level report, regional breakdowns and various housing markets are used as examples, so it becomes rather obvious that the national housing market is in name only. In fairness to CMHC, they do summary results of 15 Census Metropolitan Areas (CMAs) so you do get an appreciation of just how different some local markets are in relation to others.
The Canadian Real Estate Association (CREA), in its monthly national releases, falls into the same trap with media headlines that misrepresent what is occurring within various regions and local markets. Whether Canadian home sales are up or down each month — and similarly with the average sales price — you would think it should be logical to deduce that it is simply an aggregate calculation of a large pool of sales. As a result, it isn’t really helpful to you depending on where you live in the country.
Like CMHC, CREA goes into further detail than simply posting aggregate numbers. It acknowledges that the high average national sale price number every month is not reflective or representative in any way of most, if not all, local markets in the country by indicating it is highly skewed by sales in Greater Toronto and Greater Vancouver.
Case in point is CREA’s July market release for June monthly sales activity. It points out that the actual national average price for homes sold in June 2018 was just under $496,000, and then indicates that if you exclude the two highest priced markets noted above, the national average price reduces to $389,000. While this aggregate number is still not representative of any local market, it at least shows how influential these two major markets can be in shaping final outcomes in our reported national numbers.
In its monthly market releases, CREA always states …” all real estate is local, and REALTORS® remain your best source for information about sales and listings where you live or might like to live”.
Herein lies the problem. Since many readers, radio listeners, or television viewers are just getting quick snapshots of what brief news coverage there is on the current state of our housing market, they can easily fall victim to misinformation that does not at all represent what they are experiencing in their local market.
This issue can even make it difficult for REALTORS® working in any local market to explain to their buyers or sellers the pitfalls of falling victim to sensational, or at least very misleading, national real estate stories. So a big shout-out goes to the Financial Post on its July 18 article, “Location, location, location: Why our national housing market is a myth”.
Essentially, the article puts to rest the fallacy that there is only one housing market in the country.
“Whereas the national housing market is the sum of its parts, it’s the parts that matter because consumers do not see or experience the national averages. Housing prices and sales volumes are inherently relevant at local levels.”
The article then delves into other aspects of the market, such as month-to-month comparisons. It makes another good observation about which you need to be aware of when reading real estate market reports. Quoting CREA’s July market release, a comparison is made from June 2018 to May 2018. This year June was better than May, however, if you compare the same month in 2017, sales are actually down nearly 7 per cent. So you have to be careful about how you are describing the market.
WinnipegREALTORS® is careful to cite the same months or same periods of time when comparing home sales activity. This is not to say, as it did this year, that it won’t note a previous month’s activity if it is trying to denote a trend. But it will never try to imply sales are better when they are not in comparison to the same month in the previous year.
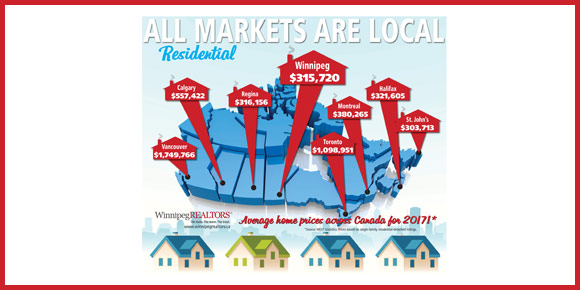
In any local real estate market release, it becomes evident that Winnipeg’s housing prices are nowhere near where Toronto’s or Vancouver’s are, or even other higher-priced housing markets in Canada. But instead of trying to analyze all of this information on your own, talk to a REALTOR® about differences in prices within local market neighbourhoods and MLS® property types.
You can find previous WinnipegREALTORS® market releases online at www.winnipegrealtors.ca under Resources.