
by Peter Squire
Canadian Real Estate Association (CREA) market analyst Ryan Biln wrote a thoughtful communication to Realtors last year about looking beyond the average price when it comes to market trends. He used Mark Zuckerberg, CEO of Facebook, as an example, explaining that if billionaire Zuckerberg joined a small group of ten people who each earned about $50,000, his income would skew the average income sky-high for the group in this calculation, as you are simply dividing the total by the number of people to come up with the average.
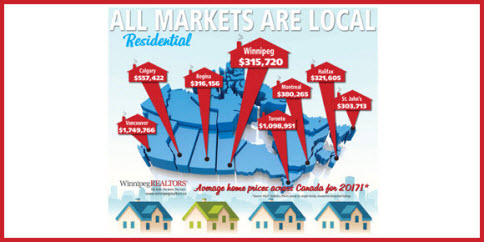
This has been the case nationally when CREA releases its monthly market stats. Due to house prices in Greater Toronto and Greater Vancouver being more expensive than any other housing market in the country, coupled with being two of the most active in sales activity, CREA will cite the average price with both included, and then remove them to show what a difference they make in contributing to a higher national average sales price. In January 2018, the national average price for homes was $481,500; however, it is reduced to $374,000 when you remove these two markets from the equation.
It can happen in local markets as well, but not to the same extent unless you have some very expensive homes selling in significant numbers in comparison to all other home sales. In Winnipeg’s case, if you use above $500,000 as the upper end of the market, its percentage of total home sales in 2017 only represented 7.6%. This is far from seismic in its impact, but over time — through incremental changes and shifts in sales activity from lower price ranges to higher ones — you will see upward movement in your average sale price.
Generally, WinnipegREALTORS® stays away from focusing on average sales price, especially over a short period of time, and focuses more on where sales activity is happening within the entire price range spectrum. As explained above, average price is not always the best metric to use when assessing market trends. In the Greater Winnipeg market, the $250,000 to $299,999 price range is still the most active for single family home sales, while for condominiums the busiest price range is from $150,000 to $199,999.
Where average sales price can be more useful as a gauge of the market is when you are tracking a large MLS® area with a similar composition of homes. You then essentially have many sales or a larger pool of numbers falling within a narrower range of price differences.
West End
Housing Opportunity Partnership
A good example of how WinnipegREALTORS® uses average price effectively was when it set up the Housing Opportunity Partnership (HOP) in the late 90s. HOP is a not-for-profit housing initiative dedicated to renewing neighbourhoods through the provision of housing for first-time buyers. It has strategically targeted West End neighbourhoods east of Arlington Street.
What HOP learned through analysis in the 90s was how much the area’s average sale price was plummeting due to deterioration in the condition of housing stock and general neighbourhood decline. The average sale price was a key metric in determining what type of intervention was required to stop the decay and create a revitalized, stabilized and healthier neighbourhood where home buyers would choose to live.
Other metrics were used as well, such as number of days to sell a home listed on the MLS® market, and what percentage of home listings in the area were being converted to sales.
In the case of the West End, it was clear from what was happening in the 90s that the average sale price was declining and it had nothing to do with any change in the mix of sales as we see more nationally when sales activity heats up in higher priced housing markets or conversely lower priced markets fare poorly in their sales activity.
A house price index is a better way of assessing price trends since, as Biln pointed out, “unlike average and median prices, it is not prone to being distorted by changes in the sales mix from one month to the next.”
Sales activity as
barometer of economy
If WinnipegREALTORS® has a bias when it comes to looking at any of the market metrics, it will always be on sales activity, as it is a valid barometer of the economy. If it’s increasing, it’s an indicator of growth in the housing market, with more Manitobans successfully completing one of the biggest investments they will make in their lifetime.
Whether you are reading a market release from CREA or WinnipegREALTORS®, you will often see a comment along the lines of what CREA President Andrew Peck said in their January market release: “A professional Realtor is your best source for information and guidance in negotiations to purchase or sell a home during these changing times.”
The reason for this is simply that market trends, with all of the aforementioned metrics noted for Canada, or even a local market such as Greater Winnipeg, will not help a buyer or seller fully understand the myriad factors governing the pricing of property. An experienced Realtor can help you navigate this often complex range of data, and assist you in making an well-informed decision.