

Monthly, the Winnipeg Regional Real Estate Board pens a column to update readers on the previous month’s real estate performance in our market region. Thanks to advances in technology used by the Winnipeg Regional Real Estate Board and it’s REALTOR® Members, we access a wide range of MLS® statistics to share monthly trends for the benefit of readers.
In this column, I wanted to shed insights into the terms and statistics used in our monthly market update.
Residential detached homes
Let’s start with the terms used to define property types. Residential Detached homes are used to describe a home that stands on its own and when it is purchased, comes with the home and land it sits on. It is also sometimes referred to as Single Family Detached. Owners are responsible for all repairs and maintenance and changes to the inside and outside can be done so long as they conform to local by-laws and regulations.
Condominiums
Condominiums or Condos for short, refer to an arrangement where the owner owns the unit but not the land it is built on or the common spaces outside the unit. There are many types of properties utilized but most condominiums are apartment style buildings. The owner is charged monthly fees to help pay for common elements shared by other condominium owners, as well as maintenance, parking areas, and recreation facilities, to name a few. These fees are in addition to mortgage payments.
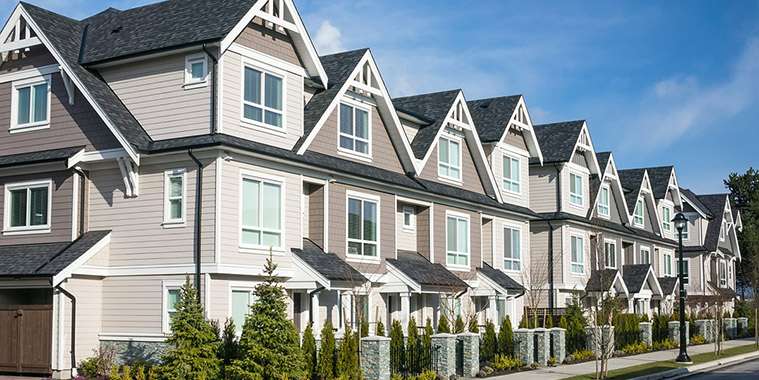
Residential attached homes
Residential Attached refers to homes joined on one side to another home or homes under one roof. Like Residential Detached homes, Residential Attached homeowners are responsible for all repairs and maintenance to their portion of the building and changes to the inside and outside can be done so long as they conform to local by-laws and regulations.
MLS® sales
Moving on to statistics, MLS® sales refer to the total number of properties sold within a designated timeframe. For the purposes of the monthly market update, we list the total sales for the previous month and compare them to the previous year and the 5-year average to give reference points on how much sales have increased or decreased.
New listings vs. active listings
New listings, refer only to the total number of new listings that became available in a given month.
Active listings mean the total number of homes still available on the market at the end of a given month. This is also compared against the previous year and the 5-year average. This is also referred to as inventory.
Average price
Average price is the total dollar sum of all MLS® sales divided by the number of units sold. Using June Residential Detached statistics as an example, there was a total dollar volume of $473,773,232 and 1,133 Residential Detached homes sold and when divided, it equals an average price of $418,158. Average prices are also compared against the previous year and the 5-year average.
Percent sold above/at/below list price
Two statistics that are used to help illustrate demand in the marketplace, are ‘percent sold above/at/below list price’ and ‘sales to active listings ratio’. The percent sold above/at/below list price statistic will identify the percentage of homes sold for a given property type above, at, or below list price. While there are many factors that could influence the reasons individual homes might sell above, at, or below list price, when taken as total number, there are trends at play. Typically, when most homes are sold above list price, it means that demand is strong across the market and buyers are putting in offers above list price to ensure they get the home they want because of likely competition. On the other hand, when most homes are sold below list price, it typically means that demand is softer and there is more choice for buyers who aren’t facing as much competition for the homes they want.
Sales to active listings ratio
The sales to active listings ratio is another way to illustrate demand in the marketplace and it is calculated by taking the total number of MLS® sales in the previous month and dividing by the total number of active listings available at the end of the month. It is expressed as a percentage and is useful because it tells you about the rate at which MLS® sales are going through active listings. In June, there were 1,614 MLS® sales and 4,164 active listings available at the end of the month for All MLS® property types. When divided, you get 38.76% and this means that for every 100 active listings available, there were 38.76 MLS® sales. When this number is high, like in June of 2021 when it was at 69.4%, it shows that demand was high and there were nearly 70 MLS® sales for every 100 active listings available. When the number is lower, like in June of 2019 when it was 25.58%, it shows that demand was lower and there were many more active listings available than MLS® sales occurring.
These are some of the terms and statistics used in our monthly updates. REALTORS® are the experts when it comes to determine the market value range of properties and have access to comparable sales data on the MLS® system. To search for a professional REALTOR® visit: www.winnipegregionalrealestatenews.com
Jeremy Davis is the Winnipeg Regional Real Estate
Board’s Director External Relations & Market Intelligence.