

By Peter Squire
In 2020, the Winnipeg Regional Real Estate Board (WRREB) adopted the MLS® HPI. It is a home price index the Canadian Real Estate Association (CREA) developed in partnership with Altus Group to help REALTORS® back up their comparable market assessments when they price a home for a listing.
Using MLS® data drawn from more than a decade of sales history, the developers of this sophisticated program were able to determine what they call a HPI benchmark concordance house that fits a typical property within each market and market sub-area. The baseline and start year for CREA’s MLS® HPI is 2005 and it tracks monthly price trends and levels beginning in January. Each month you get an update on how that typical house is trending.
HPI is seen as a far more accurate measurement of calculating house pricing trends than average or median prices since the latter are more volatile and can swing dramatically (e.g. especially on a monthly basis) in response to changes in the proportion of high-end or low-end sales.
HPI overcomes the wide differences and composition of properties included in average and median pricing by keeping the qualities of a typical property constant over time so its change in value is the result of pure price change. This is a more stable price indicator than average prices because it tracks changes of “middle-of-the-range” or “typical” homes. The four property types it tracks are one-storey and two-storey homes, condo apartments and townhouses. There is also a single-family home index and benchmark price which is a composite of the one-storey and two-storey homes most common in the area being tracked.
HPI is comparable to the well-known Consumer Price Index (CPI) which tracks consumer price inflation or deflation through following a constant basket of goods and services such as food, clothing and transportation. The MLS® HPI measures the rate at which house prices change over time by taking into account a basket of housing features which remain constant (e.g. square footage, lot size, year built, number of bathrooms, bedrooms, finished basements, heating systems, etc.) This makes the MLS® HPI the best tool for “apples-to-apples” historical price trend comparisons.
CREA’s senior economist Shaun Cathcart described the HPI this way when asked about it when doing a special Q&A session at the annual WRREB 2021 Market Insights event held on February 3. “The fundamental thing about the HPI is it exists at the neighbourhood and property type level for REALTORS® to use, and they have exclusive access to the absolute best, most stable price metric at that extreme granular level.” He added, “It is an extra tool in the toolkit and is the best of the best to do this.”
Cathcart also stated that 2020 was the biggest expansion of HPI since CREA first launched it, doubling its reach from 20 to 40 housing markets and really making it a national HPI with the majority of housing markets now participating.
Gauging home price trends now that the WRREB is clearly in a sellers’ market — with tight listing supply conditions — will be that much more important in 2021. The local real estate market pre-pandemic was balanced and saw active listings at the end of each month improve right up until the end of March with 4,723 active MLS® listings, a 12% increase over 2019. But by the end of 2020, MLS® listings dropped to just 2,316, with many MLS® areas having a very limited number of residential-detached listings (e.g. in the single the digits going into this year). To be expected, January was no different. At this point, an influx of new listings would be very helpful in bulking up a low listing supply heading into spring, which is typically a very active time for home sales.
By now, we all know that the cause of this shortage was the economic shutdown that started at the end of March and continued well into May of 2020. New listings that should have been coming onto the market fell significantly and never did recover. Then, sales roared back in June and continued at far higher levels (e.g. 7 consecutive record months) for the rest of the year. Listings in a number of those record sales months were not even close to matching 2019 numbers, let alone increasing to make up the deficit from earlier in 2020.
The MLS® HPI is not only a valuable new tool for REALTORS® to use when listing a home, but one that the WRREB can utilize to determine how current market conditions are affecting house prices in different areas. Winnipeg, for example, is very different from the vast rural region that makes up our entire market. MLS® sales activity was up noticeably outside the city, in part due to the well documented shortage of listings in highly sought after Winnipeg neighbourhoods. But what about prices between the two?
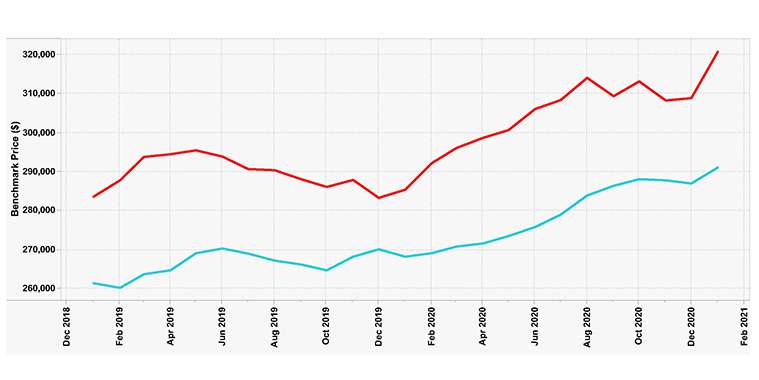
As you can see from the MLS® HPI chart, rural prices are following an upward trajectory, like Winnipeg, but at a lower price point profile and lesser incline. For the 12 month HPI price trend period up to the end of January 2021, Winnipeg showed a 12.4% increase in single family homes as it went from $285,400 to $320,800. For rural areas, the single family home HPI benchmark price rose from $268,200 to $291,100, an 8.5% increase.
This is just one example of how to use MLS® HPI based on the MLS® market in 2020.
Rest assured, the WRREB will be watching its new MLS® HPI price gauge tool to stay informed on price movement throughout 2021.
Peter Squire is the Winnipeg Regional Real Estate Board’s Vice-President, External Relations & Market
Intelligence.